How to create jaw dropping Data Visualizations on the web with D3.js?
Story telling using great visualizations.
Thus article goes into the details of creating great visuals leveraging D3 JavaScript library. It introduces the user into concepts provided by the D3 library.
Some of the steps includes:
- Refreshing previous concepts of D3.js
- A glance at advanced concepts: Scales, Axes and Reading data from external sources
- Building basic charts and code reusability
- Line Chart
- Area Chart
- Chart as a modular structure
- Case Study
- Visualizing Game of Thrones Social Network – Force Directed Graph in action!
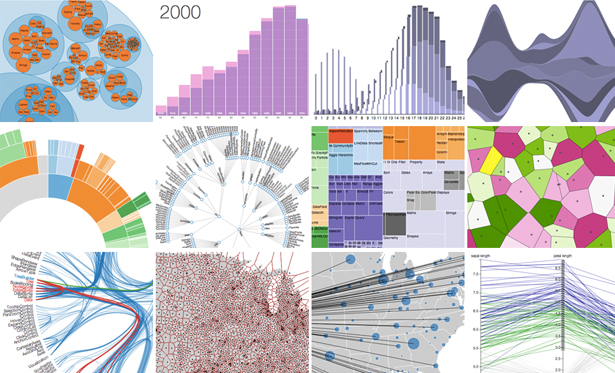
- Case Studies – Some interesting charts built using D3.js
- Introduction to Dimple.js – D3 made easy!
Definitely a great read if you are trying to learn the D3.js library or if you’re trying to learn some basics on creating stunning visuals speaking volumes on numbers.
Check out the link at: https://www.analyticsvidhya.com/blog/2017/08/visualizations-with-d3-js/
Interested in the D3 Library then see this link: https://d3js.org/
If you’re exclusively interested in Charts then a framework that leverages the D3 library will be of interest to you: http://c3js.org/
Cheers!