Book Recommendation: The Cartoon Guide To Statistics
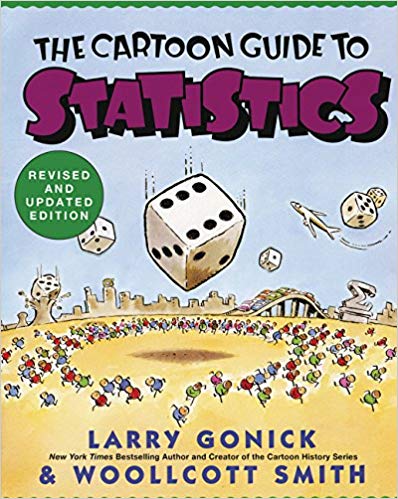
tl;dr Book Review: The Cartoon Guide To Statistics by Larry Gonick & Woollcott Smith

I’ve been working with big data over a decade. I’ve dealt with system and monitoring solutions that puts out over a million IoT sensor data every few minutes. Streaming them, storing them, analyzing them and finding ways to slice and dice that data has always been interesting to me. And this has built my career the past 15 years. I am constantly trying to find new ways ways to show and represent the data in an UI dashboard and to try to find interesting anomalies in the data patterns. And each time, I thought to myself that this work is complete, I always learn that the universe has a new twist and it teaches me that there are new ways to slice and dice that data than I have considered before. This could be as simple as an email newsletter broadcast with some content all the way to something as complex as displaying file system statistics in a meaningful way. But fundamentally all this slicing and dicing data ends up involving “statistics” in some shape or form. And that brings me to the book I’m going to talk about today!
I would like to recommend a book that I’ve been reading lately on this topic of “statistics”. The title of the book is “The Cartoon Guide To Statistics”, written by Larry Gonick & Woollcott Smith. There are a series of cartoon books written by Larry Gonick and they are all equally good. Larry tries to take a complex subject and explain it in plain simple terms using cartoons as an aid.
In this book, both Larry and Woollcott begin by introducing the topic of “what is statistics?”. They then lead the reader to “understanding what data is all about”. They then introduce the audience to the topic of “probability” which then naturally leads to “randomness” and “random variables”. Then they talk about “distributions” and “sampling”. Then the remaining chapters talk about “testing”, “experimental design” techniques and “regression”.
Overall the approach the authors took to graphically explain complex problems was very good. Their reach into associating how history evolved the field of statistics was welcoming (such as the aristocrats gambling which led to the growth of probability theory). You also get a glimpse on characters like - the Roman Emperor, Claudius and his book “How to win at dice?”, the renaissance, Chevalier De Mere that questioned the rolling of the dice and the outcomes which eventually led to Blaise Pascal and Pierre De Fermat coming up with the “theory of probability”.
Overall they took a dry subject and made it fun to read on a Saturday afternoon. [A little glass of wine (and some great weather) helps you along the way as well.]
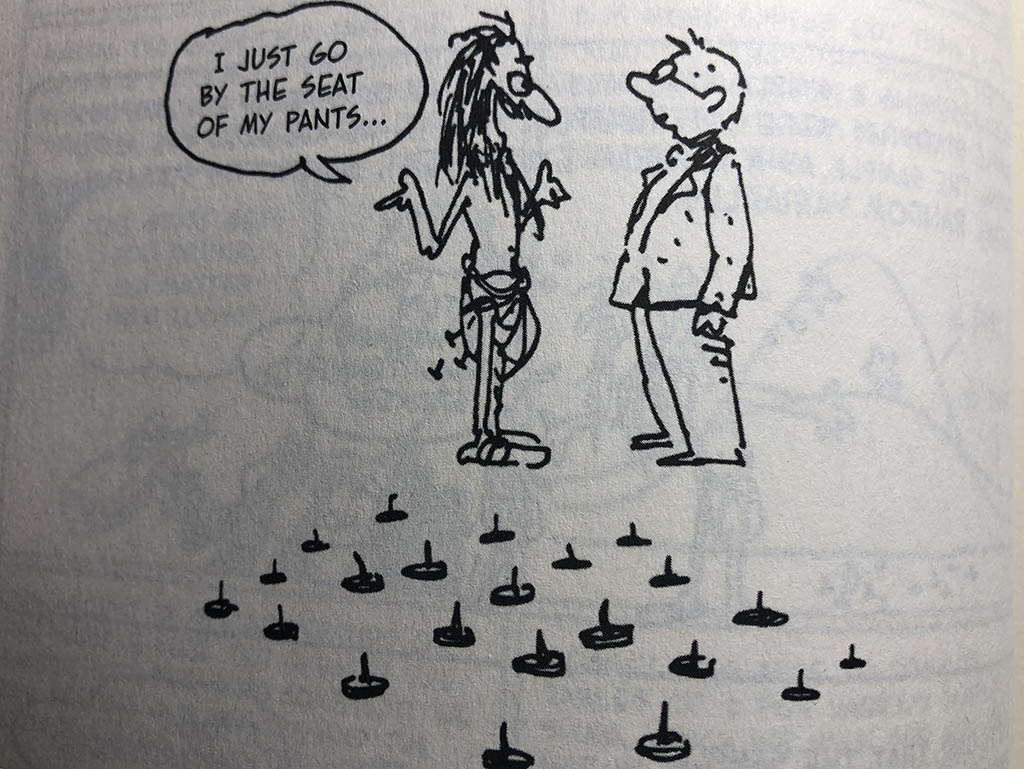
Here is a sample of one of my favorite cartoons from the book on the topic of “Statistical Inferences”:

In summary, I would highly recommend this book to anyone seeking to learn about Statistics in a fun way. If you want to check out the book on Amazon, here is a link:
The Cartoon Guide to Statistics
PS: I am not affiliated or benefiting from the link in any way.
Cheers!
If you find this article useful, consider bookmarking, subscribing and/or sharing it on your favorite social channels so that others can also find and read these articles. I do this out of love and passion to share my ideas, thoughts, findings and knowledge with others. So the more you help me share the more my content can reach others. Thank you for helping spread the word!
Now for Today’s Inspiration:
The wealth of the ignorant does more harm
than the want of the learned.
- Thirukkural 450CE (in Tamil) : on Ignorance :: couplet 408_
(considered one of the greatest works ever written on ethics, morality & chiefly secular ethics

